TREND
Fits a straight line to data using linear regression and returns points on that line.
Syntax:
TREND(yvalues, xvalues, new_xvalues, type)
yvalues and xvalues are single row or column ranges specifying points in a set of data.
TREND fits a straight line through these data points, using the linear regression method.
If type is 0 the straight line found will pass through the origin; if type is non-zero or omitted the best fit straight line will be found.
TREND returns an array of the y values of the straight line found, corresponding to the x values in new_xvalues (or if omitted xvalues).
yvalues and xvalues must be the same size. new_xvalues may have a different size.
Example:
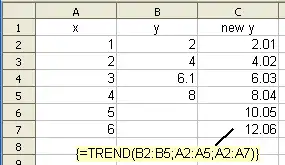
TREND(B2:B5, A2:A5, A2:A7)
when entered as an array formula in cell C2, where the x values in A2:A7 are 1,2,3,4,5, 6 and the y values in B2:B4 are 2, 4, 6.1, 8 returns {2.01|4.02|6.03|8.04|10.05|12.06}. The data points are very nearly on the line y = 2x (and would be if B4 contained 6 instead of 6.1). The best fit line found is therefore very nearly y=2x.
This example shows how TREND may be used to predict future values.

Application:
Predicting Home Prices in a New Suburb
Imagine a real estate analyst is tasked with predicting the future median home prices in a newly developed suburb. The suburb, named "Sunrise Estates," has been undergoing rapid growth, and the analyst wants to estimate what the median price will be in a few years to help potential investors and home buyers.
The analyst has collected the following historical data for the past five years:
Year (x) | Median Home Price in Sunrise Estates (y) | ||
|---|---|---|---|
A | B | ||
1 | 1 | $450,000.00 | |
2 | 2 | $475,000.00 | |
3 | 3 | $510,000.00 | |
4 | 4 | $550,000.00 | |
5 | 5 | $580,000.00 |
The analyst wants to predict the median home price for years 6 and 7. They use a statistical method to project the existing trend. This method, often referred to as linear regression, finds the best-fit straight line through the existing data points. The slope of this line represents the average rate of price increase per year, and the intercept is the starting point.
The analyst uses a function that calculates this linear trend based on the known 'y' values (the median home prices) and the known 'x' values (the years). The function then applies this established trend to new, future 'x' values (years 6 and 7) to predict the corresponding 'y' values (the future median prices).
In this example, the TREND function would take the known price data ($450,000, $475,000, $510,000, $550,000, $580,000) and the known years (1, 2, 3, 4, 5) as its inputs. The analyst would then use the function to find the predicted prices for the new years 6 and 7. The output would be the estimated median home price for each of those years, following the established linear trend.
How TREND is used in the example:
- It establishes a relationship: The function first analyzes the historical data to determine the linear relationship between the year and the median home price. It finds the line of best fit that most accurately represents the past price increases.
- It extrapolates the trend: Once the relationship is established, the function uses it to project forward. It takes the future years (6 and 7) and, based on the calculated trend, predicts what the corresponding median home prices will be, assuming the historical pattern continues.
- The result is a prediction: The output of this function provides a data-driven prediction for the future, which can be a valuable tool for stakeholders in the real estate market. For instance, the function might predict the price in year 6 to be approximately $615,000 and in year 7 to be around $650,000.
The TREND calculation, which is based on linear regression, is as follows:
- Find the trendline: A linear regression analysis is performed on the historical data to find the line of best fit, represented by the equation y=mx+b, where m is the slope and b is the intercept.
- The slope (m) is the average rate of increase in price per year, which is calculated to be $33,500.00.
- The intercept (b) is the predicted price at year 0, which is calculated to be $412,500.00.
- Predict future values: Using the calculated trendline equation (y=33500x+412500), the median home prices for years 6 and 7 are predicted by substituting the respective year values for x.
- For year 6:
- For year 7:
The results of the calculation are:
- The predicted median home price for year 6 is $613,500.00.
- The predicted median home price for year 7 is $647,000.00.
TREND function used for calculation: TREND({450000, 475000, 510000, 550000, 580000}, {1, 2, 3, 4, 5}, {6, 7})
Result for TREND({450000, 475000, 510000, 550000, 580000}, {1, 2, 3, 4, 5}, {6, 7}):
PRODUCT & FEATURES
RESOURCES
Terms | Privacy | Spam Policy
© 2026 Zapof